Xgboost のR における具体例 (クラス分類)
前回、Xgboost のパラメータについて列挙しましたが、あれだけ見ても実際にどう使うのかよく分かりません。そこで今回はR で、とりあえず iris data を用いてその使い方を見ていきたいと思います。
まず、iris data の奇数番目を訓練データ、偶数番目を検証データとします。
dim(iris) # 行数:150, 列数:5
odd.n<-2*(1:75)-1
iris.train<-iris[odd.n,] # 奇数を訓練データ
iris.test<-iris[-odd.n,] # 偶数を検証データ
次に、xgboost に適した形式に変換します。
library(xgboost)
y <- iris.train[,5] # 目的変数
y <- as.integer(y)-1 #xgboost で既定されいるクラスは 0 base

train.x<-iris.train[,1:4]
x <- rbind(train.x,iris.test[,-5]) # xgboost を使うときのため
x <- as.matrix(x)

trind <- 1:length(y) # 先程定義したx の中の訓練データを指すのに使う
teind <- (nrow(train.x)+1):nrow(x) # 先程定義したx の中の検証用データを指すのに使う
必要最低限のパラメータの設定は次のようになります。
set.seed(131) # 固定シードで試す
param <- list("objective" = "multi:softprob", # 多クラスの分類で各クラスに所属する確率を求める
              "eval_metric" = "mlogloss", # 損失関数の設定
              "num_class" = 3 # class がいくつ存在するのか
              )
実際に、予測をする前に最適な木の数を探します。
k<-round(1+log2(nrow(train.x)))
cv.nround <- 100 #search
bst.cv <- xgb.cv(param=param, data = x[trind,], label = y,  nfold = k, nrounds=cv.nround)
これを実行すると、次のような結果が出てきます。
[0]     train-mlogloss:0.752857+0.007342        test-mlogloss:0.772249+0.027355
[1]     train-mlogloss:0.542712+0.008457        test-mlogloss:0.569818+0.047944
[2]     train-mlogloss:0.404424+0.008669        test-mlogloss:0.441932+0.068164
[3]     train-mlogloss:0.306743+0.007542        test-mlogloss:0.351062+0.084861
                                          (略)
[25]    train-mlogloss:0.032532+0.003092        test-mlogloss:0.122064+0.128217
[26]    train-mlogloss:0.031981+0.002944        test-mlogloss:0.121880+0.128820
[27]    train-mlogloss:0.031499+0.002809        test-mlogloss:0.121960+0.128635
                                          (略)
[97]    train-mlogloss:0.023760+0.001694        test-mlogloss:0.134890+0.156262
[98]    train-mlogloss:0.023744+0.001690        test-mlogloss:0.135084+0.156458
[99]    train-mlogloss:0.023728+0.001686        test-mlogloss:0.135296+0.156967
この場合、訓練データにおける最適な木の数は26+1(0 baseのため)となります。
これを基に予測をしてみます。
set.seed(131)
nround <- 27
# モデルの構築
bst <- xgboost(param=param, data = x[trind,], label = y, nrounds=nround)
pred <- predict(bst,x[teind,]) # モデルを使って予測値を算出
pred <- matrix(pred,3,length(pred)/3) # 今回は3クラスあるので
pred <- t(pred)
colnames(pred)<-c("setosa","versicolor","virginica")
結果を見てみると、
head(pred,3)
        setosa  versicolor   virginica
[1,] 0.9838002 0.008915161 0.007284546
[2,] 0.9870363 0.008944485 0.004019236
[3,] 0.9870363 0.008944485 0.004019236
となっていて、各データが"setosa","versicolor","virginica"のどれに属するかの確率が求められています。この中の最大値をとるクラスに、そのデータは属すると思われます。
このような確率に興味がなく、どこのグループに属するかだけを知りたいなら次のように"multi:softmax"を使います。
param <- list("objective" = "multi:softmax", # multi:softmax に変更!
                "eval_metric" = "mlogloss",
                "num_class" = 3
                )
set.seed(131)
nround <- 27
bst <- xgboost(param=param, data = x[trind,], label = y, nrounds=nround)
pred <- predict(bst,x[teind,])
データを整えて、結果を見てみます。
for(i in 1:length(pred)){
  if(pred[i]==0) {pred[i]="setosa"}
  else if(pred[i]==1) {pred[i]="versicolor"}
  else {pred[i]="virginica"}
}
table(iris.test[,5],pred)
# 結果
            pred
             setosa versicolor virginica
  setosa         25          0         0
  versicolor      0         23         2
  virginica       0          0        25
これが良いのかどうかいまいち分からないので、とりあえずランダムフォレストと比較してみます。
odd.n<-2*(1:75)-1
iris.train<-iris[odd.n,] # 奇数を訓練データ
iris.test<-iris[-odd.n,] # 偶数を検証データ
# randomForest
library(randomForest)
set.seed(131)
train.x<-iris.train[,1:4]
train.y<-as.factor(iris.train[,5])
model.rf<-tuneRF(train.x,train.y,doBest=T)
pred<-predict(model.rf,iris.test[,-5])
table(iris.test[,5],pred)
# 結果
            pred
             setosa versicolor virginica
  setosa         25          0         0
  versicolor      0         24         1
  virginica       0          2        23
これだけでは、なんとも言えなさそうですが、xgboost の性能の高さは認めらるかなと思います。
追記(2015/05/06): 変数重要度を求めることができることに気が付いたので追記しておきます。
# 変数重要度を求める
imp<-xgb.importance(names(iris),model=bst)
print(imp)
# print の結果
        Feature        Gain      Cover Frequence
1: Petal.Length 0.663081352 0.63384270 0.4453125
2:  Petal.Width 0.318246635 0.24789925 0.2656250
3: Sepal.Length 0.011982305 0.09317686 0.2187500
4:  Sepal.Width 0.006689708 0.02508119 0.0703125
# print の結果ここまで
xgb.plot.importance(imp) # これをグラフで表示
変数重要度を図示したものがこちらになります。

ランダムフォレストで変数重要度がどうなるのかも気になるので試してみます。
# 変数重要度を求める(和が1になるように調整)
print( model.rf$importance /sum(model.rf$importance) )
# print の結果
             MeanDecreaseGini
Sepal.Length       0.01306678
Sepal.Width        0.01388757
Petal.Length       0.42804382
Petal.Width        0.54500183
# print の結果ここまで
varImpPlot(model.rf) # 図示(略)
xgboost とランダムフォレストでずいぶん変数重要度が異なっていました。異なる基準を採用しているのかまでは、まだ調べられていません。(分かり次第また更新しようと思います。)
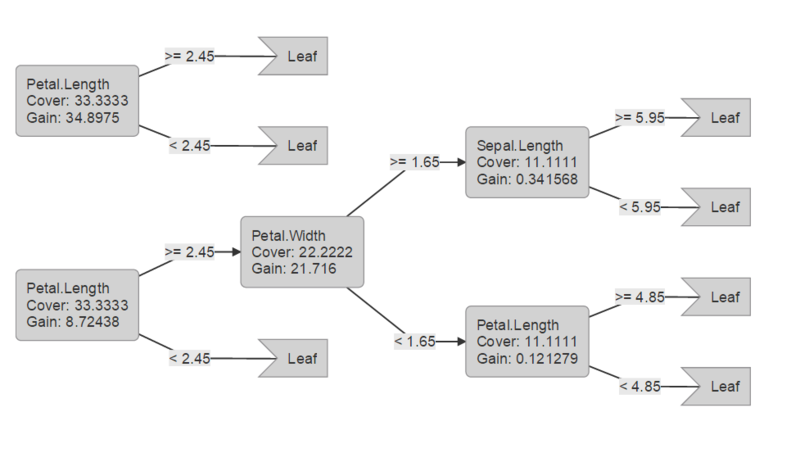
追記(2015/6/22): 決定木ベースの手法なので、決定木も出力できた方が良いかと思ったので、追記しておきます。
# 決定木を表示
xgb.plot.tree(feature_names=names(iris[,-5]),model=bst, n_first_tree=2)
これを実行すると次のような図がhtml 形式のファイルで出力されます。

追記(2016/11/14): xgb.plot.tree を実行しても木が出力されないエラーに遭遇したのでコメントを付記しておきます。現在cran にあるパッケージではエラーがでるようでgithub からインストールすれば、正しく木が表示されました。
追記(2015/04/30):今回使用したコードはpublic gist にup しておきます。
introduction to xgboost · GitHub
今回用いたiris のデータでは、パラメータ調整してもほとんどその効果が見られないため、改めて別のデータで試してみるか検討してみます。(やる場合にはGW中にup する予定です) 2015/04/30 0:40 追記